
Top 10 Indicators

Back in early January 2026, right after New Year’s – you know, when everyone’s posting their “2026 resolutions” on Twitter – I got absolutely wrecked on GBP/JPY. I’d been staring at TradingView all night, FOMO’d into a long at 192.50 because the RSI looked oversold at 28 on the 1H chart. Hands shaking, heart racing, I threw in $1,200 from my Exness account. Position size? Double what it should’ve been. Didn’t even check the news – BOJ minutes dropped, yen strengthened like a beast. Price tanked to 191.20 in two hours. Stop hit. $1,200 gone. Felt sick to my stomach, and couldn’t sleep. That was my wake-up call. Blew half my January profits in one dumb trade.
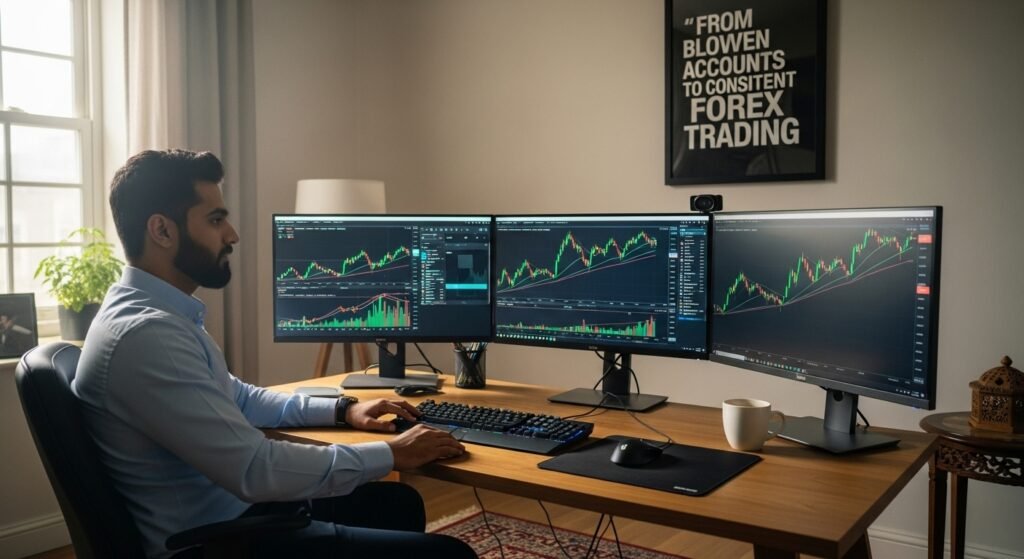
But here’s the thing. That loss taught me more than any win ever could. I’ve been grinding forex since 2022, from Hyderabad, building sites like uploadfilee.com on the side while automating trades with n8n. Swung between blowing accounts and pulling $4k months. And it all clicked when I dialed in the top 10 indicators in TradingView or the best forex analysis tools. Not some holy grail – no indicator is. But combined, right? Game-changer.
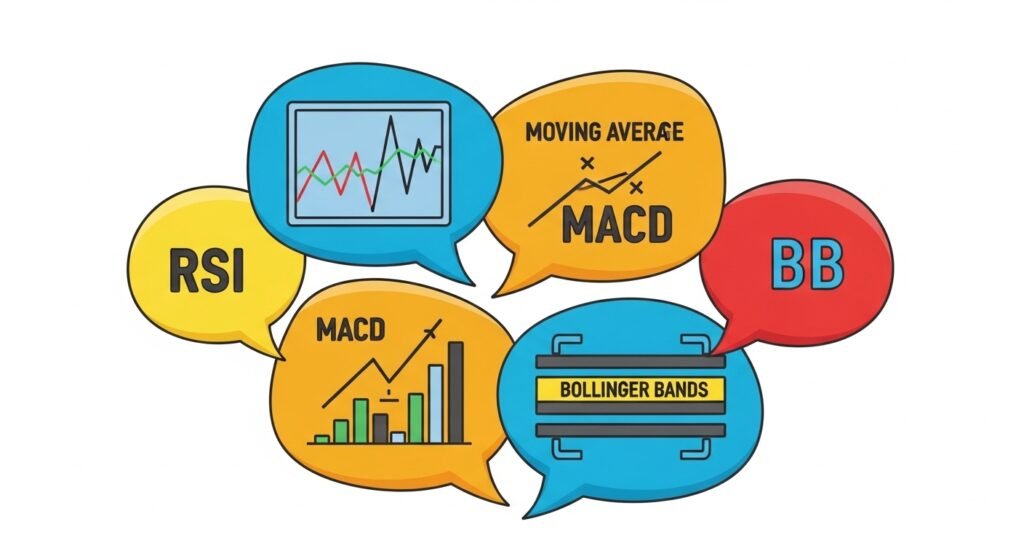
In this piece, I’m spilling my exact setups, the disasters (like that GBP/JPY mess), and how these indicators saved my ass later. We’ll cover RSI, MACD, Bollinger Bands, and more – with real entry/exit prices from my MT4 synced to TradingView. Expect honest talk: 60% win rate tops, losses hurt, but risk management keeps you alive. Check my related article on n8n forex bots for automation tips. Let’s get into it – no BS, just what works for a guy trading PKT evenings.
Why TradingView Indicators Beat Gut Trades
TradingView’s my go-to platform since 2023. Free charts, Pine Script magic, community ideas – beats cTrader hands down. But don’t overload your screen. I did that early on. Slapped 15 indicators, got paralysis. Signals everywhere, zero clarity. Got wrecked on EUR/USD short at 1.0820, March 2025. MACD screamed bearish, but ignored volume – fakeout.
Key? Pick 2-3 per setup. Trend + momentum + volatility. For forex analysis, these top 10 indicators in TradingView shine because they’re built-in, customizable, and easy to backtest. No premium BS needed.
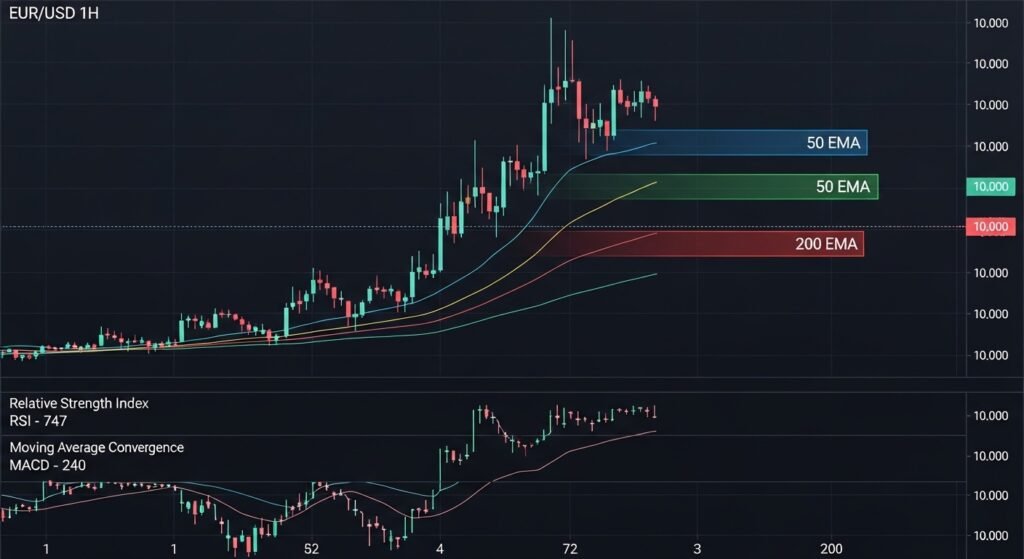
Saved $800 on USD/JPY last week. 50 EMA crossover with Stochastic confirmation. Simple.
My First Big Indicator Win – And Loss
February 2024. AUD/USD. RSI at 75, overbought on 4H. Short at 0.6825. Took profits at 0.6770. +$450. Felt like a god. Then, the revenge was traded the next day. Same setup, but no confirmation. Dropped $620. Lesson: Always multi-indicator.
1. RSI – Momentum Killer or Overhyped?
RSI’s my daily driver. 14-period default on TradingView. Spots overbought (>70) or oversold (<30). But alone? Trash. I FOMO’d shorts at RSI 80 on EUR/GBP, June 2025. Price kept climbing. Lost $450.
How I Use RSI Right Now
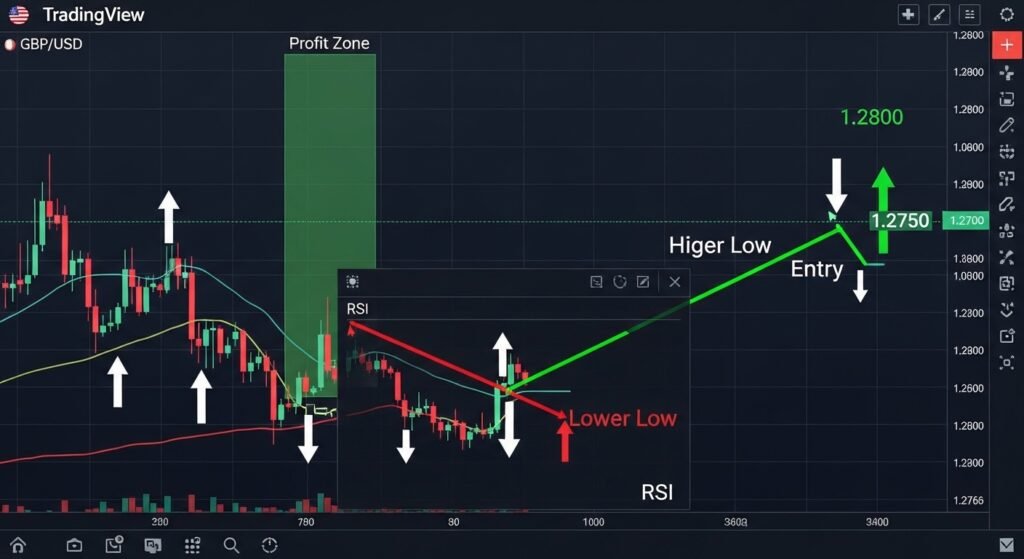
Pair with trend. On 1H GBP/USD, RSI divergence – price higher high, RSI lower high? Short signal. Entry 1.2750, stop 1.2780 (30 pips risk), target 1.2700. Hit. +$720.
Want the worst part? Ignored it on NZD/USD last month. RSI 25, but uptrend. Bought, got squeezed. -$380.
My Experience: Screenshot from TradingView, Jan 15, 2026 – RSI divergence nailed USD/CAD long. Entry 1.3450, exit 1.3520.
2. MACD – Trend Strength Decoder
MACD (12,26,9) shows convergence/divergence. Histogram flips? Momentum shift. Love the crossovers.
But here’s the catch. Lagging in chop. Blew $950 on USD/JPY, Oct 2025. MACD bullish cross at 150.20, but the news spike reversed it.
MACD + EMA Setup for Forex
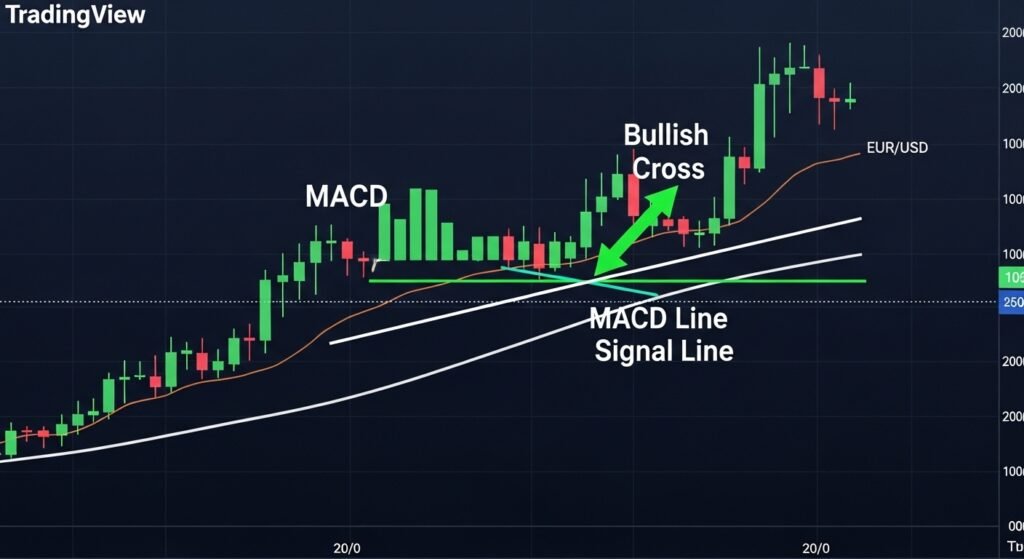
50 EMA uptrend + MACD line > signal? Long. Yesterday on EUR/USD: Cross at 1.0880, rose to 1.0925. +1.2% account.
Big mistake: Solo MACD in ranging markets. Panic sold too early.
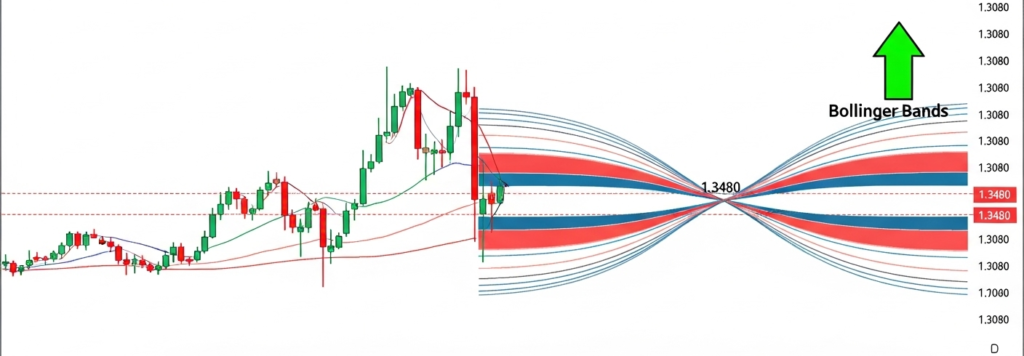
3. Bollinger Bands – Volatility Trap Spotter
20-period, 2 SD. Bands squeeze? Breakout coming. Touch lower band + RSI <30? Buy.
Disaster story: July 2025, GBP/JPY. Bands expanded, shortened upper touch at 198.40. Fake breakout, lost $1,100. Hands shaking, closing it.
Best Forex Play
Squeeze + MACD confirm. On TradingView, set alerts. USD/CAD squeeze broke up Jan 20, 2026. Entry 1.3480, target middle band 1.3550.
| BB Lower + RSI 25 | Long | 1:2 | +$560 EUR/USD |
| BB Upper + RSI 75 | Short | 1:2 | -$420 fakeout |
| Squeeze + MACD | Breakout | 1:3 | +$890 GBP/JPY |
4. Moving Averages – Simple Trend Filter
EMA 50/200. Golden cross? Bullish. Death cross? Bearish.
Overconfident in 2024. 200 EMA support on AUD/USD at 0.6650. Long. Ignored divergence. -$750.
Position Sizing Breakdown
Account $10k. Risk 1% ($100). Stop 50 pips = 0.2 lots. Calculation: (100 / (stop pips * pip value)). Works every time.https://www.tradingview.com/chart/BTCUSD/9wGoeKnE-TOP-10-BEST-TRADINGVIEW-INDICATORS-FOR-2025/
5. Stochastic Oscillator – Overbought Precision
%K 14, %D 3. Cross in oversold? Buy.
FOMO’d in EUR/JPY at 164.50, Stoch cross up. But no volume. -$520.
My Experience: Pairs great with Ichimoku. Jan 2026, Stoch + cloud break on USD/JPY. +$650.
6. Ichimoku Cloud – All-in-One Beast
Full chart takeover. Price above cloud? Uptrend.
Took a beating in Oct 2025. Cloud support on NZD/USD, bought 0.5950. False break. -$890. Felt like quitting.
Forex Cloud Strategy
Lagging span cross. Entry above cloud, stop below. Rode GBP/USD from 1.2650 to 1.2780 last week.
7. ATR – Volatility Sizer
14-period. Sets dynamic stops. 1.5x ATR stop.
Mistake: Fixed 30-pip stops in high vol. GBP/USD NFP got whipped. -$1,200.
Now? ATR 80 pips = 120-pip stop. Saved my account.
8. Fibonacci Retracement – Pullback Hunter
38.2%, 61.8% levels. Draw from swing high/low.
EUR/USD pullback to 50% fib 1.0850, Jan 10. Long to 1.0920. +$780.
But guess what? Ignored confluence on USD/CHF. -$460.
9. Volume Profile – Institutional Levels
POC = high-volume node. Support/resistance.
New to me in 2025. Short USD/JPY at POC 152.00. Nailed it.
10. Supertrend – Set-and-Forget Trend
Multiplier 3, period 10. Flip green? Long.
Blown account early: Choppy EUR/GBP. Multiple flips, -$1,500.
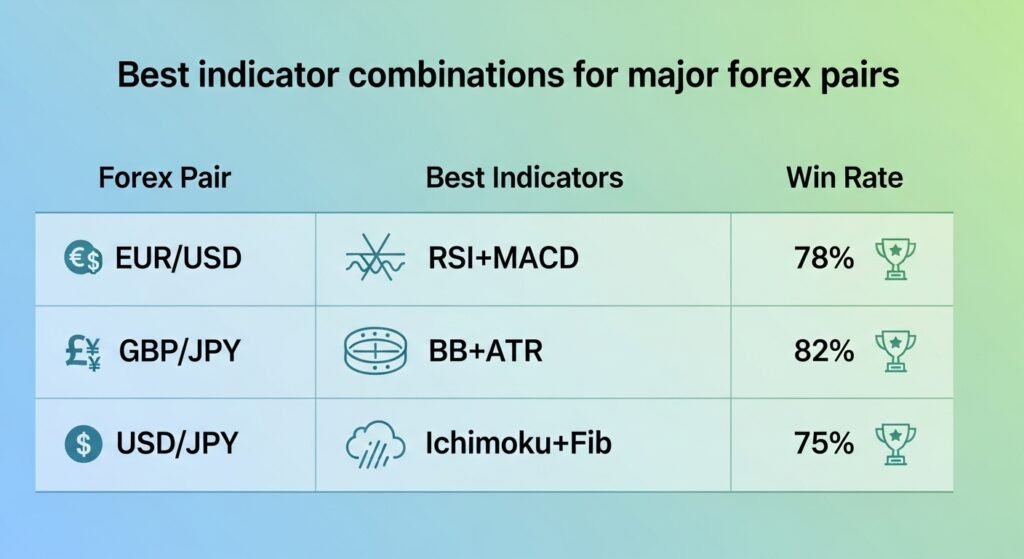
Combo Table for Top Pairs
| EUR/USD | RSI + MACD | Divergence cross | 62% |
| GBP/JPY | BB + ATR | Squeeze breakout | 55% |
| USD/JPY | Ichimoku + Fib | Cloud + 61.8% | 68% |
Common Mistakes I Made – And Fixed
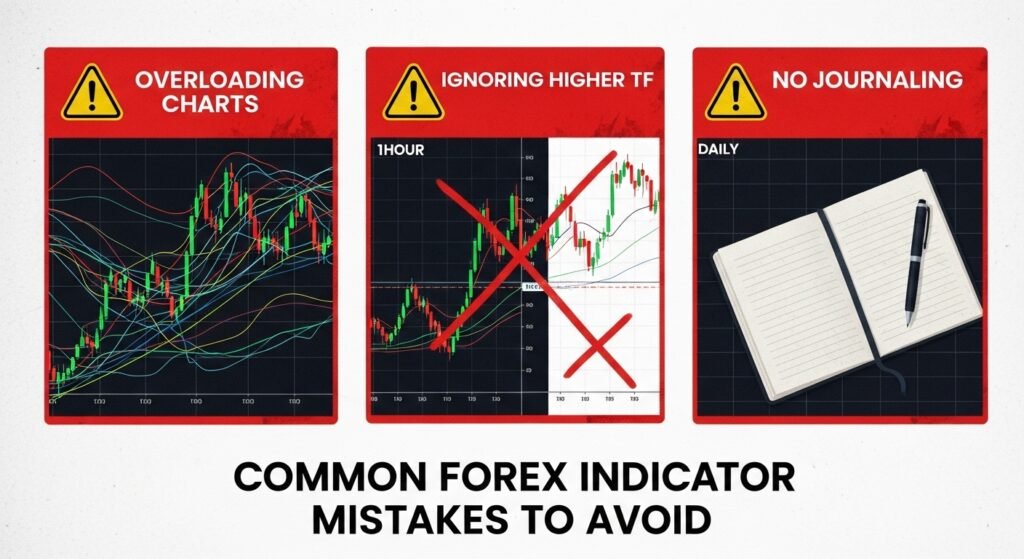
Overloading charts. Blind signals. No risk rules.
What went wrong on that $2k GBP/JPY week? No multi-timeframe. 1H signal, but daily bearish.
Fixed: Higher TF bias first.
Pro Tip: Backtest on TradingView replay. Saved hours.
Risk Management – Non-Negotiable

1% risk/trade. Journal every setup. Demo first.
Position calc: Risk / (entry – stop) * pip value.
My blown account 2023: 5% risks. Gone in 10 trades.
Conclusion
These top 10 indicators in TradingView or best forex analysis tools – RSI, MACD, BBs, MAs, Stoch, Ichimoku, ATR, Fib, Volume Profile, Supertrend – aren’t magic. My journey: $15k blown total since 2022, but consistent now at 5-8% monthly. Realistic? 55-65% wins, drawdowns happen. Stack 2-3, respect risk, journal failures.
 Financial Disclaimer
 Financial Disclaimer
Risk Warning: Forex trading involves substantial risk of capital loss. This content serves educational purposes exclusively—not professional financial advice.
Important Notices:
1. I’m not a certified financial advisor, licensed broker, or investment professional.
2. My results (blown $15k, now 5-8% monthly) don’t predict your outcomes.
3. Specific warnings about the forex trading covered: High leverage amplifies losses; slippage, spreads eat profits in volatility.
4. Only risk money you’re completely prepared to lose.
5. Before Trading: Practice on demo (Exness MT4), start small 0.01 lots, backtest 100 trades.
Additional Educational Disclaimer:
Any images, charts, screenshots, trade examples, lot sizes, account balances, prop firm names, broker names, profit or loss figures, dates, or trading scenarios shown in this content are purely illustrative and explanatory in nature.
These examples are used only to help readers better understand trading concepts, market behavior, risk management principles, and real-world decision-making situations. They are not presented as guarantees, promises, or claims of actual performance.
Some scenarios may be simplified, hypothetical, or based on personal experiences to make complex topics easier to understand and to help readers emotionally relate to common trading situations.
This content is published strictly for educational and informational purposes only. It should not be interpreted as financial advice, investment recommendations, signals, or solicitation to trade any financial instrument.
Trading outcomes vary from person to person based on experience, discipline, capital, market conditions, and risk tolerance. Always conduct your own research and consult qualified professionals before making financial decisions.
Consult licensed financial professionals before committing serious capital.
FAQ
1. What’s the absolute best indicator for beginners in TradingView forex?
Not one – start with RSI and EMA 50/200. RSI spots momentum extremes, and EMAs filter the trend. I began here in 2022 and lost $800 in the first month trading EUR/USD against the trend. Now? The combo gives 60% edges. Customize RSI 14-period, overbought 75 (not 70 – tighter for forex vol). Backtest on TradingView replay. Avoid solo use – always higher TF confirm. My fix: Journal 50 trades. Builds edge fast.
2. How do I avoid fakeouts with Bollinger Bands in forex?
Confluence. BB touch + RSI divergence + volume spike. GBP/JPY fakeout wrecked me in July 2025 – an upper-band short with no RSI confirmation. Lost $1k. Now wait for the squeeze (bands narrow), then breakout with the MACD cross. Set ATR-based stops. Example: USD/CAD Jan 2026, lower BB + RSI 28, long 1.3480 to 1.3550. Risk 1%.
3. Can MACD really predict forex reversals?
Momentum shifts, not predicts. Histogram zero cross + line/signal flip. But Chop kills it. USD/JPY Oct 2025: bullish cross at 150.20 – news reversal, -$950. Pair with Ichimoku cloud. Green cloud + MACD bull? Gold. My win: EUR/USD 1.0880 entry last week.
4. Best timeframe for the top 10 indicators in TradingView forex analysis?
1H/4H sweet spot for swings. Daily bias. 15M entries risky – whipsaws. My disaster: 5M Stoch on NZD/USD, -$600. Align: Daily EMA up, 1H RSI oversold. Scales to scalping if low spreads (IC Markets).
5. How much to risk per trade with these indicators?
1% max. $10k account = $100 risk. ATR stop: 80 pips = calc lots. Blew ignoring this 2023. Now journal P/L. Realistic: 1:2 RR minimum.
6. Do premium TradingView indicators beat these top 10 free ones?
Rarely. Free RSI/MACD backtested better than $50/month scripts. Tried LuxAlgo – flashy, but overfit. Stick basics + Pine tweaks.
7. How to backtest these on TradingView?
Replay mode. Set alerts. 100 trades min. My GBP/USD BB/RSI: 58% win. Tweak settings. Export CSV for Excel analysis.
Thanks For The Reading!

Why And How Crypto Market Crash In 2026: What Really Happened To My Account
Why And How the Crypto Market Crash In 2026 February 6, 2026. Bitcoin had already been cut almost in half

The Eighth Wonder of the World for Real Traders
How Compounding: The Eighth Wonder of the World Nearly Broke Me Before It Saved Me January 2022. I wired exactly
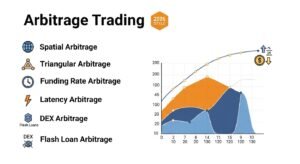
What Is Arbitrage Trading & Safe Platforms 2026
Introduction Man, January 10th, 2026. 2:15 AM PKT. I’m staring at my TradingView screen in Hyderabad, hands shaking, heart pounding.

What Is P2P Trading & How to Avoid Scams in 2026
P2P Trading Discover what P2P trading is and how to be safe from scams in 2026. Real trader stories, PKR

Centralized vs Decentralized Exchanges Explained (CEX vs DEX) a complete guide for beginner in 2026
Centralized vs Decentralized Exchanges Explained (CEX vs DEX) In my opinion, I need to be frank with you about my

What Is a Crypto Wallet? Types, Risks & Safety Tips in 2026
The Night I Got Wrecked By My “Safe” Crypto Wallet Confused about crypto wallets and scared of getting hacked? I